

Oregon Issues
Cost of Living in the Tech Corridor: Protecting the Middle Class

Tech corridor cost of living: seven Washington County pressures
Tech corridor cost of living is best understood as a Washington County household budget, not one headline number. Housing, wages, transportation, child care, food, utilities, and health expenses use different datasets and time periods. A useful comparison identifies the place, year, unit, and inflation basis for every figure.
Beaverton, Hillsboro, and rural Washington County are not identical markets. Renters, homeowners, commuters, families with children, and people working different shifts experience different costs. County averages can provide context, but they should not be presented as the bill faced by every household.
Housing needs a defined measure
Housing can be described through rent, owner costs, sale prices, vacancy, supply, or cost burden. Those measures are not interchangeable. Oregon Housing and Community Services provides housing-needs context, while local analysis should preserve each source’s geography and date.
A housing-cost table should say whether dollars are nominal or adjusted for inflation, whether a figure covers the county or wider metro area, and whether it represents a median, average, or share of households. That detail prevents false comparisons across sources.
Income and wages answer different questions
Household income can include earnings from multiple people and other income sources. Occupational wages describe workers or jobs. The Census Bureau’s American Community Survey and Bureau of Labor Statistics Oregon resources can support these measures, but their definitions and release schedules differ.
When comparing wages with expenses, use compatible years and geographies. Do not treat a projected opening, a current vacancy, an advertised salary, and an occupational median as the same evidence.
Transportation and care shape access to work
A job’s practical value depends partly on the cost and time required to reach it. Fuel, transit, vehicle ownership, parking, and shift schedules can change a household calculation. Child care and after-school coverage can also determine whether a training or work schedule is feasible, even when the posted wage looks competitive.
Growth is not a single-cause explanation
Semiconductor and supplier activity can create demand and opportunity, but the article should not attribute housing prices or every local cost change to one employer, subsidy, or policy without evidence. Population, construction, interest rates, household formation, infrastructure, and broader markets may also matter.
The site’s guides to Silicon Forest workforce development and skilled-trade careers can connect opportunity with training without turning a cost comparison into a causal claim.
Build a transparent local dashboard
For this local cost guide, publish each measure with source, date, geography, unit, and update schedule. Showing county and city-level data side by side, where compatible, makes local differences visible and keeps a changing market from being frozen into an undated narrative.
An update log should note revised datasets and methodology changes. If two sources conflict, retain both definitions and explain the difference rather than choosing whichever number makes the strongest headline.
A trustworthy tech corridor cost of living guide separates evidence from inference. It helps Washington County readers compare housing, earnings, transportation, care, and other expenses using compatible definitions while acknowledging that no single average describes every family or community.
Primary and authoritative sources
Editorial note: This explainer summarizes public sources and distinguishes verified facts from proposals and commentary.
A Washington County cost-of-living dashboard with comparable measures
The tech corridor cost of living is not one official number. It is a household budget assembled from housing, utilities, transportation, food, health care, child care, taxes, and other recurring needs. Each component may come from a different dataset, geography, release schedule, and unit of measurement.
Oregon Housing and Community Services provides housing-needs context, the Census Bureau provides demographic and household measures, and the Bureau of Labor Statistics provides Oregon labor-market context. A local dashboard should retain each source’s definitions instead of blending unlike figures into one dramatic total.
Choose a household and geography before comparing costs
A single adult, a family with children, a renter, a homeowner, and a multigenerational household can face very different expenses. A tech corridor cost of living comparison should therefore identify the example household, tenure, work location, and time period before presenting a monthly or annual total.
Washington County, Hillsboro, Beaverton, a census tract, and the wider metropolitan area are not interchangeable geographies. The dashboard should show the geography supplied by each source and avoid assigning a regional estimate to a city when the source does not support that level of detail.
Keep housing measures distinct
Rent, owner costs, sale price, vacancy, housing supply, and cost burden answer different questions. Oregon housing-needs material can frame statewide and regional pressures, while Census tables can help describe household tenure and cost burdens. None of those measures alone represents every household’s housing bill.
A housing row should state whether it reports a median, average, percentage, asking price, completed transaction, or modeled estimate. It should also show the observation period and whether dollars are nominal or inflation-adjusted. That detail prevents an older annual estimate from being compared directly with a current monthly listing.
Compare earnings with expenses carefully
Household income, individual earnings, occupational wages, and advertised salaries are different measures. Bureau of Labor Statistics resources can support occupation and labor-market context, while Census data can support household measures. A valid comparison aligns the year and geography as closely as the source data permits.
The practical question is not simply whether a posted wage is high. Transportation, care responsibilities, schedule, benefits, and housing location affect how much of that income remains available. The dashboard should label these as household circumstances rather than attributing every difference to the technology sector.
Add transportation, care, and recurring services
Commuting costs can include vehicle ownership, fuel, maintenance, parking, transit, and unpaid travel time. Child care or after-school care may determine whether a schedule is workable. Utilities, insurance, and health expenses can also change independently of rent or wages. Each component needs its own source and update date.
For the tech corridor cost of living, a range is often more honest than a single point estimate. A range can show how assumptions change for renters and owners, different household sizes, or different commute patterns without pretending that one scenario describes all of Washington County.
Maintain an update and revision record
A durable dashboard lists measure, source, geography, period, unit, release date, and next expected update. When a source revises historical values or changes a definition, the revision note should preserve the earlier method and explain why the current series is not directly comparable.
The result is a tech corridor cost of living resource that readers can audit. It shows which expenses changed, when they changed, and which households the comparison describes while leaving causal claims to evidence designed to test them.
Washington County affordability is best explained through compatible measures and visible assumptions. Housing, earnings, transportation, care, and recurring services belong in the same household conversation, but they should retain their separate definitions, dates, and geographic limits.
Official sources for this reference section
Serving Oregon’s 1st Congressional District
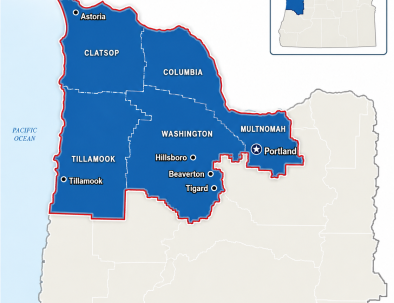
Oregon’s 1st Congressional District includes Clatsop County, Columbia County, Tillamook County, most of Washington County, and part of Multnomah County, including Portland’s west side.
These priorities affect Hillsboro, Beaverton, Tigard, Forest Grove, Astoria, Warrenton, Seaside, Tillamook, St. Helens, Scappoose, Vernonia, Rainier, Clatskanie, west Portland, and communities across northwest Oregon.
Related visual context
Source-credited images connected to the article’s policy, geography, or public-accountability themes.